Figure 4.
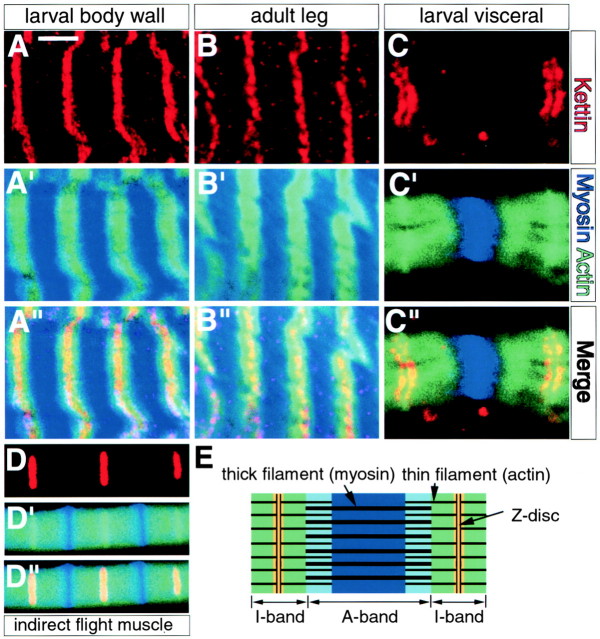
Z-disc expression of Kettin in several muscle types. (A, A′, and A′′) Larval body wall muscles. (B, B′, and B′′) Adult leg muscles. (C, C′, and C′′) Larval visceral muscles. (D, D′, and D′′) IFMs. Kettin (red) expression images (A–D) and anti-MHC (blue)/FITC-phalloidin (green) double staining pictures (A′–D′) are merged in (A′′–D′′). FITC-phalloidin staining shows actin expression regions. (E) Schematically shows the relationship between muscle gene expression and sarcomere structures. In all cases examined here, Kettin is expressed exclusively in the region colored in yellow in E, or the center of actin-expressing regions, indicating Kettin in Z-discs and their immediate neighbors. By unknown reasons, the region positive to antimyosin antibody staining was much narrower than expected, in particular, in larval visceral muscles and IFMs. Bar: (A and B) 5 μm; (C) 4 μm; (D) 3 μm.

