
Figure 3.
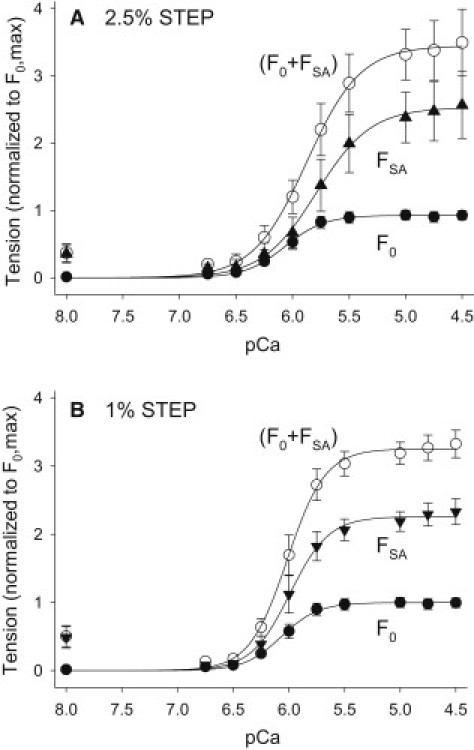
Effect of [Ca2+] on F0, FSA, and F0+FSA. (A) Tension response to 2.5% ML step over 1.5 ms. (B) Tension response to 1% ML length step over 0.5 ms. Data are normalized to each fiber's maximum isometric tension (F0,max) which was measured at pCa = 4.5 after the optimal ML was determined (see Materials and Methods). Data were fit with the Hill equation, . The F0 data are the same for both A and B and are from a separate set of fibers (N = 8) than was used to determine 1% and 2.5% FSA (N = 11). Measuring isometric tension levels and step responses versus pCa from the same fiber introduced more variability into the isometric data than measuring only isometric tension versus pCa. Values are mean ± SE.