
Figure 2.
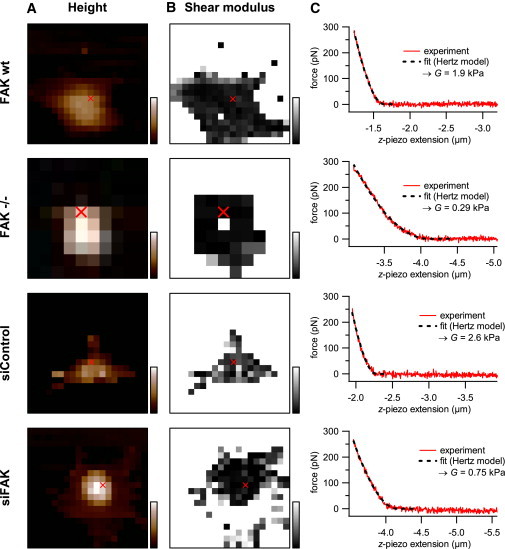
AFM force mapping. (A) Height. Scan range: 80 μm × 80 μm. Color-bar range (black to white): 0–5 μm. (B) Corresponding shear modulus. Grayscale range (black to white): 0–20 kPa. (C) Force versus z-piezo extension data at the position indicated (red cross) in panels A and B. A fit of the Hertz model to the data gives the local shear modulus at this position.