
Figure 3.
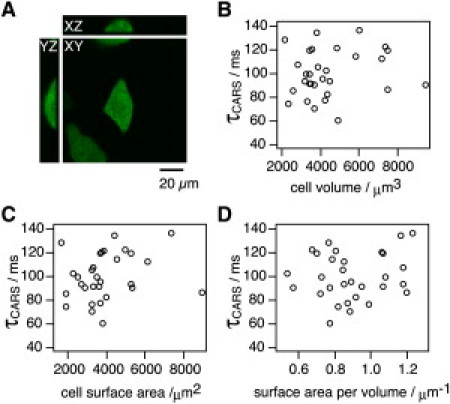
Relationships between cell morphology and diffusion time constant. (A) HeLa S3 cells expressing EGFP were imaged and analyzed using Volocity software. Orthogonal views through a single EGFP-HeLa S3 cell are shown. Scale bar, 20 μm. (B–D) Scattered plots of cell volume (B), cell surface area (C), and surface/volume ratio (D) with time constant, for 30 cells.