
Figure 4.
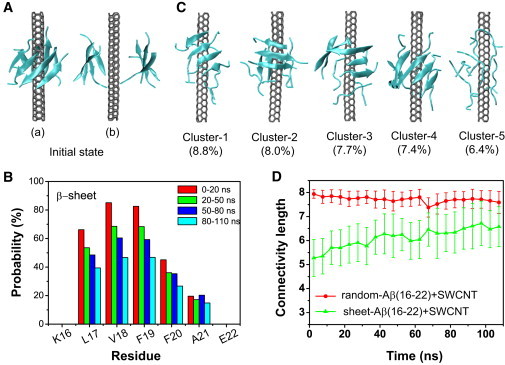
Structural analysis of Aβ(16-22) octamers generated in the 310 K REMD trajectory starting from a prefibrillar β-sheet octamer (cluster 8 in Fig. 2A) with an SWCNT placed between the two β-sheets. (A) Two different views of the initial state, where b is the perpendicular view of a. (B) β-sheet content of each residue within four time intervals: 0–20 ns, 20–50 ns, 50–80 ns, and 80–110 ns. (C) Representative structures for the first five most-populated clusters. (D) Time evolution of the CL of the Aβ(16-22) octamer in the sheet-Aβ(16-22)+SWCNT system. For comparison, the time evolution of the CL in the random-Aβ(16-22)+SWCNT system is also given. The number of CLs is averaged every 5 ns.