
Figure 5.
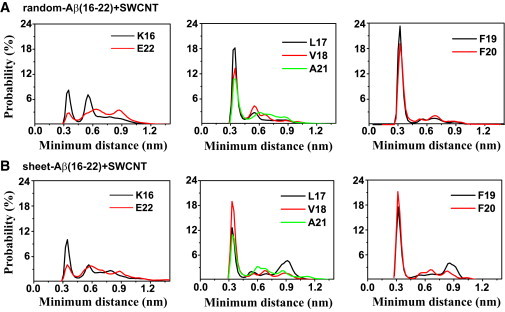
Probability distribution of the minimum distance between the side chain of each residue and SWCNT surface in the 310 K trajectory of the two REMD runs with SWCNT. The data are averaged over the last 80 ns for random-Aβ(16-22)+SWCNT and the last 40 ns for sheet-Aβ(16-22)+SWCNT.