
Figure 3.
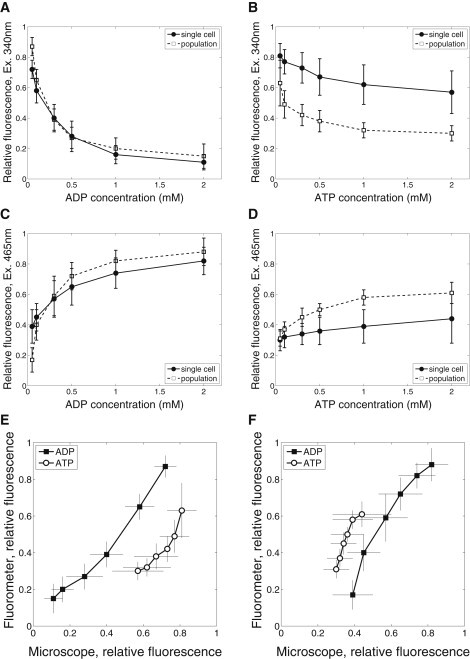
Comparison of fluorescence recordings performed on single cell level using fluorescence microscope with recordings on cell population level using fluorometer. The average fluorescence at different levels of exogenous ADP (A and C) and ATP (B and D) is shown for single cell and cell population recordings. Finally, average fluorescence recorded on single cell and population level is plotted against each other with fluorescence excited by 340 nm and 465 nm in E and F, respectively.