
Figure 1.
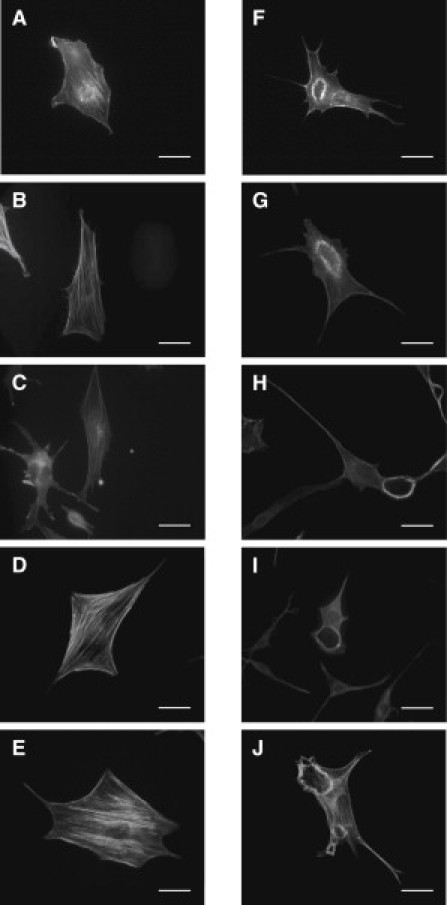
Stiffness-based comparison of CDRs formed in cells. Cells stained for F-actin before (A–E) and after (F–J) 5 min of PDGF stimulation. Cells were seeded on substrates with stiffnesses of (A and F) 20 kPa, (B and G) 50 kPa, (C and H) 250 kPa, (D and I) 1800 kPa, and on (E and J) glass. (Bars) 10 μm.