
Figure 2.
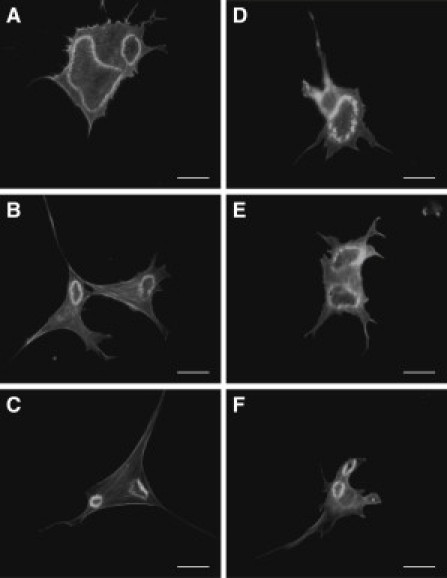
Time-based comparison of CDRs formed in cells seeded on (A–C) glass and on (D–F) 50 kPa PDMS substrates. The CDRs shown were taken of cells that had undergone (A and D) 10, (B and E) 20, and (C and F) 30 min of PDGF stimulation. (Bars) 10 μm.