
Figure 1.
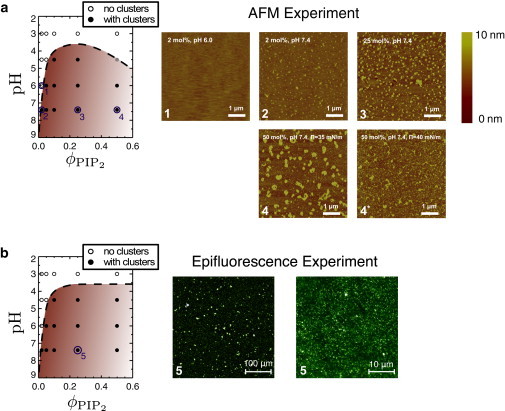
Phase diagrams (pH versus PIP2 fraction) and snapshots of experiments on mixed lipid monolayers (containing SOPC and PIP2) exposed to divalent salt. (a) Phase diagram. (Shaded coexistence region) Where clustering was observed, obtained from AFM studies. (Open disks) Parameter values where no clustering was observed. (Shaded disks are too close to the boundary to determine their behavior with certainty.) The AFM snapshots 1, 2, and 3 represent the conditions indicated by the corresponding points in the diagram: At ϕPIP = 0.02, there is no cluster formation at pH 6 but clusters are clearly present at pH 7.4. Larger domains are obtained for ϕPIP = 0.25. Domains persist when the surface pressure Π is increased to 35 or 40 mN/m (panels 4 and 4∗). (b) A very similar cluster formation phase diagram is obtained using epifluorescence with labeled PIP2. Snapshots are shown for ϕPIP = 0.25. (Left snapshot) Taken directly in the Langmuir trough. (Right snapshot) Taken after transferring the sample to a glass coverslip. We note that the apparent area fraction in the image is <0.25 because many of the PIP2 domains are too small to detect optically.