
Figure 2.
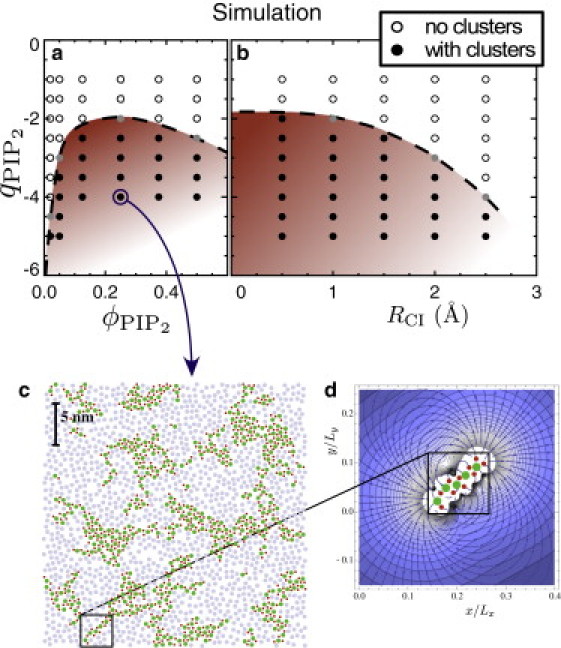
Phase diagram (charge versus PIP2-fraction) and snapshots from simulation of charged-neutral mixed lipid monolayers exposed to divalent salt. (a) Phase diagram obtained using a divalent ion radius RCI = 2 Å. (Solid disks in the shaded coexistence region) Where clustering was observed. (Open circles) Mixed samples. (Gray disks are too close to the boundary to determine their behavior with certainty.) (b) Larger divalent ions require a higher lipid charge to induce clustering (shown for ϕPIP = 0.05). (c) The simulation (PIP2 charge qPIP = −4, PIP2 fraction ϕPIP = 0.25, and divalent ion radius RCI = 2 Å) after 3.5 ns of coarsening. Charged and neutral lipids are dark green and light gray discs, respectively, and divalent ions that are close to the lipid monolayer are indicated with smaller dark red dots. (d) Strength (shaded contours) and direction (streamlines) of the electric field around a stringlike domain taken from the simulation, illustrating that further growth of the domain is likely to occur at the end.