
Figure 3.
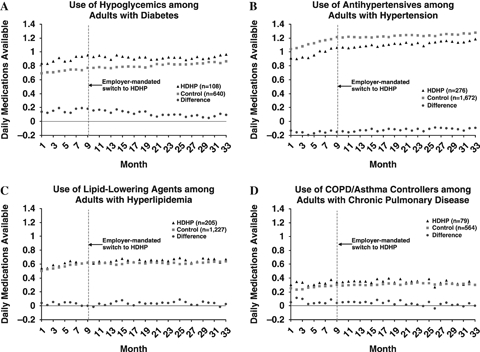
Times Series Plots Showing the Trends in Actual and Differenced Mean DMA for (A) Hypoglycemics, (B) Antihypertensives, (C) Lipid-Lowering Agents, and (D) COPD/Asthma Controllers. COPD, Chronic Obstructive Pulmonary Disease; DMA, Daily Medications Available; HDHP, High-Deductible Health Plans