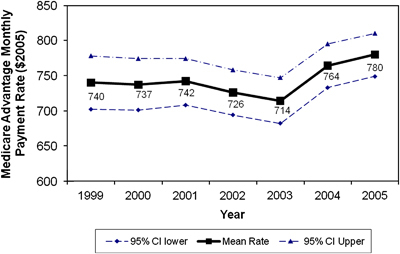
Figure 1.

Average Monthly Medicare Advantage Payment Rates (U.S.$2005) in Study Counties, 1999–2005
Source: Author's calculations based on Medicare Advantage Ratebooks, 1999–2005. 398 county years from 74 counties in Arizona, Florida, and New York with at least 10,000 Medicare beneficiaries and 3 percent Medicare Advantage penetration. All payment rates inflation-adjusted and reported in 2005 dollars.
