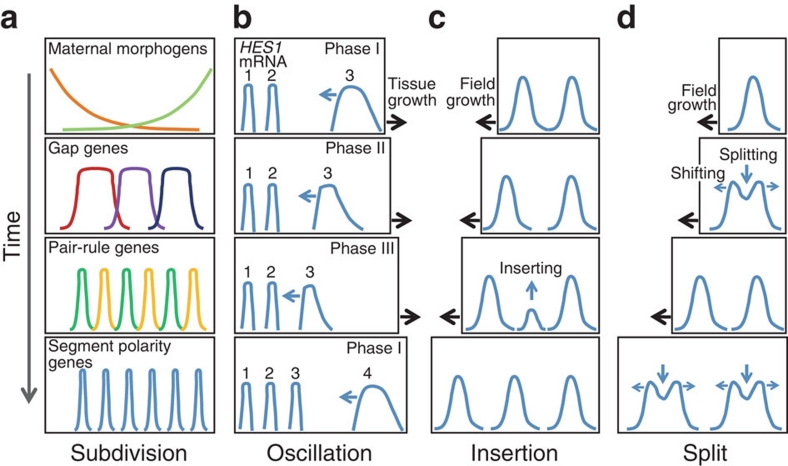
Figure 1. Various strategies to generate a spatial periodic pattern.
Blue curved lines indicate profiles of authentic or hypothetical segmental gene expression along the axis of the field. Differences are observed in how the new waves originate. (a) 'Subdivision' in segmentation of the Drosophila blastoderm embryo. Hierarchical cascades of maternal morphogens (shown in orange and light green), gap genes (shown in red, purple and dark blue), and pair-rule genes (shown in green and yellow) subdivide the embryo into progressively smaller domains and eventually lead to initiation of the expression of segment polarity genes nearly simultaneously in all of the forming segments8,9. For simplicity, some segments are omitted. (b) 'Oscillation' in segmentation of the mouse paraxial mesoderm. Oscillatory generation of new solitary travelling waves of expression of HES/hairy family genes, such as HES1, develops into a spatial periodic pattern1,10,11,12,13. The number at the peak of each wave indicates the birth order of the waves. (c) 'Insertion' of activator peaks, which has been observed in numerical simulations of reaction–diffusion systems of the activator-inhibitor type on a growing field19,20,21. Note that the new wave arises at a distance from the pre-existing waves. (d) 'Split' of activator peaks, which has been observed in numerical simulations of reaction–diffusion systems of the activator-depleted substrate type on a growing field6,19,22,35. Each cycle of splitting and shifting represents a kind of self-replication.

