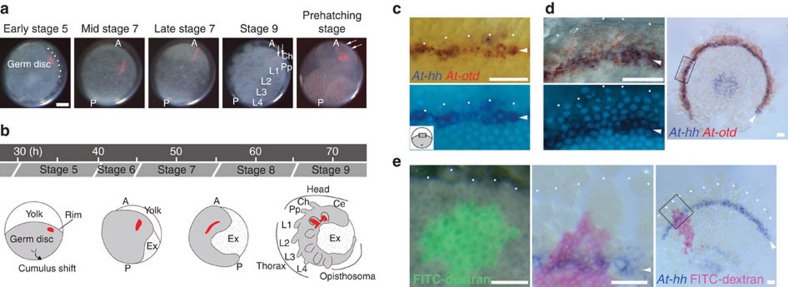
Figure 2. Movement of the At-hh expression stripe from the rim of the germ disc.
(a) Tracking of a small cell clone labelled by microinjection of RITC–dextran (red). The live embryo was photographed at stages indicated. The rim of the germ disc near the clone is dotted (early stage 5). Arrows indicate the developing Ch and Pp segments. (b) Schematic diagram of Achaearanea development highlighting the transformation of the germ disc into a segmented germ band. The tracked cell clone shown in a is depicted in red. Approximate time after egg laying is shown. (c) Expression of At-hh (purple) and At-otd (red) transcripts at early stage 5 at the rim of the germ disc (white dots). The lower panel shows the DNA fluorescence image. The inset contains an illustration of an embryo to show the orientation and the magnified region. (d) Expression of At-hh (purple) and At-otd (red) transcripts at mid-stage 6 in the anterior marginal region of the nascent germ band. Left panels are the magnified view of the boxed region in the right panel, and the lower one shows the DNA fluorescence image. White dots show the anterior margin. (e) Detection of an At-hh stripe in a tracked cell clone. An embryo having a cell clone labelled by FITC–dextran (green) more than two cells away from the rim of the germ disc (white dots) at early stage 5 (left panel) was fixed at early stage 7 and stained for At-hh transcripts (purple) and FITC–dextran (pink) (middle and right panels). The middle panel is a magnified view of the boxed region in the right panel. White dots show the anterior margin. Arrowheads indicate the At-hh stripe (c–e). Scale bars, 100 μm in a, 50 μm in c–e. A, anterior; Ce, cephalic lobe; Ch, chelicera; Ex, extraembryonic tissue; L, leg; P, posterior; Pp, pedipalp.

