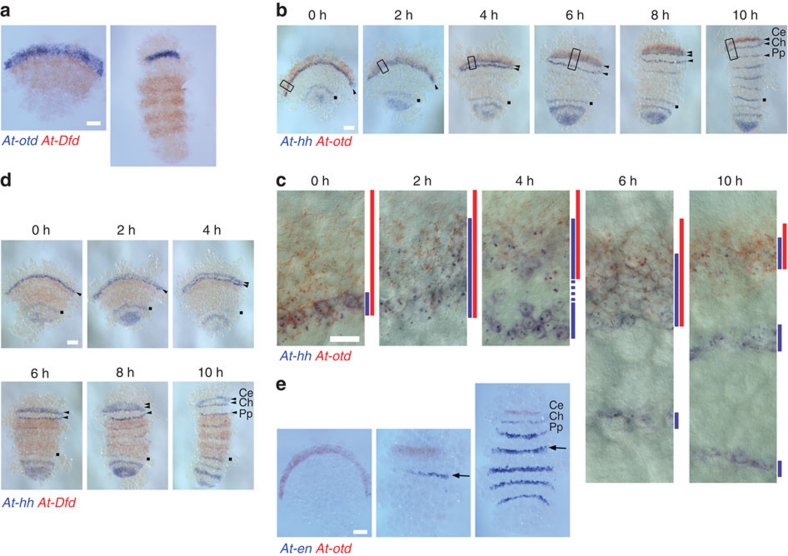
Figure 3. Repeated splitting of the At-hh stripe associated with At-otd expression.
(a) Comparison of the At-otd (purple) and At-Dfd (red) expression domains in embryos at early stage 7 (left) and stage 8 (right). (b) Embryos from a single egg sac that were fixed at 2-h intervals and stained for At-hh (purple) and At-otd (red). The first fixation was performed at early stage 7 (0 h). Arrowheads indicate At-hh stripes increasing in number in the presumptive head ectoderm. Dots indicate the At-hh stripe corresponding to the L4 segment. (c) Differential interference contrast images of the five regions boxed in b. Blue and red lines on the right of each panel indicate the ranges of the At-hh and At-otd expression domains, respectively. (d) Embryos from the same pools as in b stained for At-hh (purple) and At-Dfd (red) transcripts. The At-hh stripes are labelled in the same way as in b. (e) Embryos stained for At-en (purple) and At-otd (red) transcripts. Stage 6 (left), mid stage 7 (middle), and early stage 8 (right). Arrows indicate an At-en stripe that is likely to correspond to the L1 segment. All embryos are oriented anterior towards the top. Ce, cephalic lobe; Ch, chelicera; Pp, pedipal. Scale bars, 100 μm in a,b,d,e; 20 μm in c.

