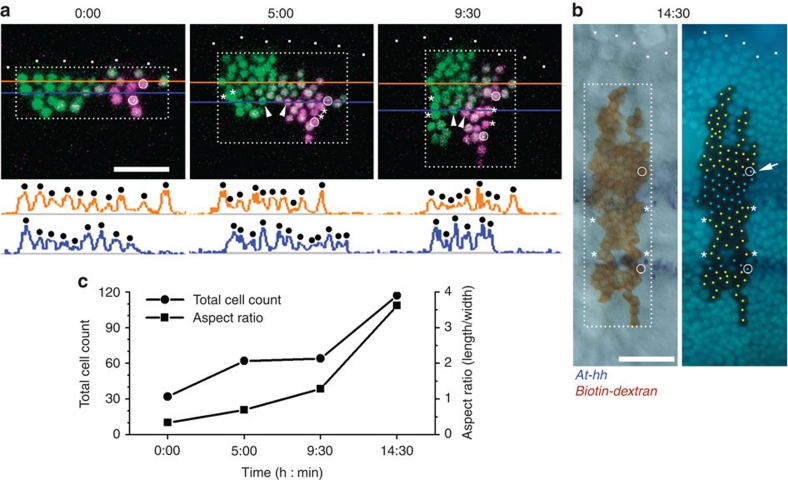
Figure 4. Splitting of the head At-hh stripe in epithelium undergoing convergent extension.
(a) Time-lapse observation of a cell clone expressing NLS-tdEosFP in the presumptive head ectoderm. The tdEosFP was photoconverted from the green (shown in green) to the red state (shown in purple) in a part of the cell clone just before time-lapse observation was performed, which started at late stage 5. A series of 10 optical sections (7.76 μm thickness) was collected every 10 min, and shown are projections of the optical sections collected at the times indicated (h:min). Arrowheads indicate two cells that were undergoing rearrangement to become adjacent to each other. Fluorescence intensity profiles along the orange and blue lines are shown below the photos to assist cell counting. (b) Detection of At-hh stripes in the observed embryo that was placed in the fixative at ∼14:30, which was 10 min after the last images were collected. The left panel shows expression of At-hh transcripts (purple) and the cell lineage tracer biotin–dextran (brown), and the right shows the DNA fluorescence image. At-hh–positive and –negative cells in the labelled area are marked by light blue and yellow dots, respectively, although the signal was ambiguous in the cell indicated by the arrow. There were 22 labelled cells in the At-hh-negative domain between the two At-hh stripes. Asterisks indicate the cells at the corners of the At-hh negative region between the two At-hh stripes (b) and their ancestral cells (a), and circles indicate the cells at the anterior and posterior ends of the two stripes (b) and their ancestral cells (a). White dots indicate the anterior margin of the nascent germ band. Scale bars, 50 μm. (c) Graph showing changes in the total cell count and aspect ratio (length/width) for the rectangles shown in a and b of the labelled area.

