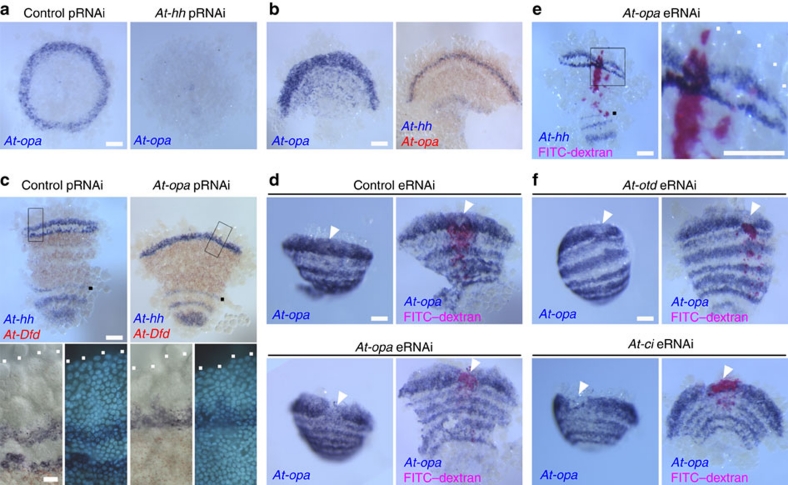
Figure 6. At-opa activity is required to promote stripe splitting and its expression is regulated by segmentation genes.
(a) Control (gfp) (left) and At-hh (right) pRNAi embryos at late stage 5 stained for At-opa transcripts. (b) Embryos at early stage 7 single-stained for At-opa transcripts (left) and double-stained for At-hh (purple) and At-opa (red) transcripts (right). (c) Control (gfp) (left) and At-opa (right) pRNAi embryos at germ band-forming stages stained for At-hh (purple) and At-Dfd (red) transcripts. The boxed areas in the upper panels are magnified in the lower panels; the right ones are fluorescence images of DNA staining. The right embryo is ∼6 holder than the left embryo (see Methods). Note that the number of At-hh stripes for the L4 (black dots) and more posterior segments is an alternative indicator of developmental stage. (d) Detection of At-opa transcripts in embryos microinjected with control gfp dsRNA (upper panels) and At-opaF dsRNA (lower panels). Each embryo was photographed before (left) and after (right) staining for the lineage tracer FITC–dextran (pink). Arrowheads indicate areas where the lineage tracer and, presumably, the dsRNAs were introduced. (e) At-opa eRNAi embryo stained for At-hh transcripts (purple) and the cell lineage tracer FITC–dextran (pink). The boxed area in the left panel is magnified in the right panel. (f) Detection of At-opa transcripts in At-otd eRNAi (upper panels) and At-ci eRNAi (lower panels) embryos. Staining and photographing were performed in the same way as in d. White dots indicate the anterior margin of the germ band, and black dots indicate the At-hh stripe in the L4 segment (c,e). Embryos shown in d–f were at early or mid stage 7. Scale bars, 20 μm in the lower panel of c, 100 μm in other panels.

