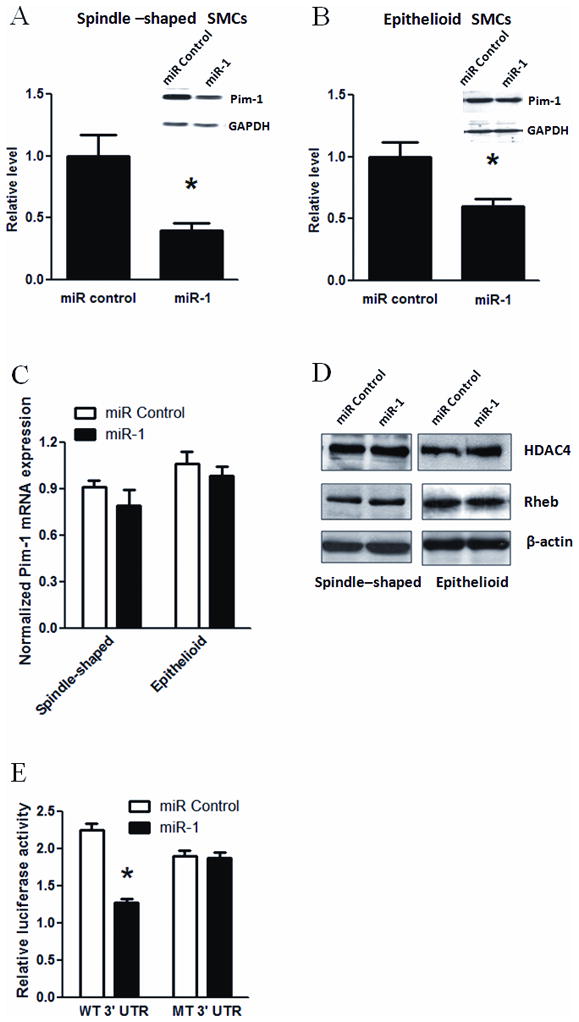
Figure 5. Downregulation of Pim-1 by miR-1 in human vascular SMCs.

A and B: Spindle-shaped (A) and epithelioid (B) SMCs were transfected with miR-1 or miRNA negative control for 48 h, followed by protein extraction and Western blot analysis using antibodies for Pim-1 and GAPDH. The y-axis indicates the expression levels of Pim-1 protein in spindle-shaped (A) and epithelioid (B) after normalized with GAPDH signals. Inserts in A and B were representative Western blots. * indicates significant difference compared with miRNA negative control (p < 0.01, n=3). C: Quantitative PCR assay showed Pim-1 mRNA level in spindle-shaped and epithelioid SMCs transfected with miR-1 or miRNA negative control. The y-axis indicates the expression levels of Pim-1 mRNA after normalization with GAPDH signals (n=3). D: Representative Western blots from 3 independent experiments showed the effects of miR-1 transfection on the expression levels of HDAC4 and Rheb in two phenotypes. β-actin served as loading control. E: Luciferase reporter assay validated Pim-1 as a target of miR-1. The reporter mRNA contained luciferase ORF and Pim-1 3′ UTR sequence with (MT) or without (WT) mutation of putative miR-1 seed sequence. The y-axis indicates the relative luciferase activity. * indicates significant difference compared with miRNA control (p < 0.05, n=4).
