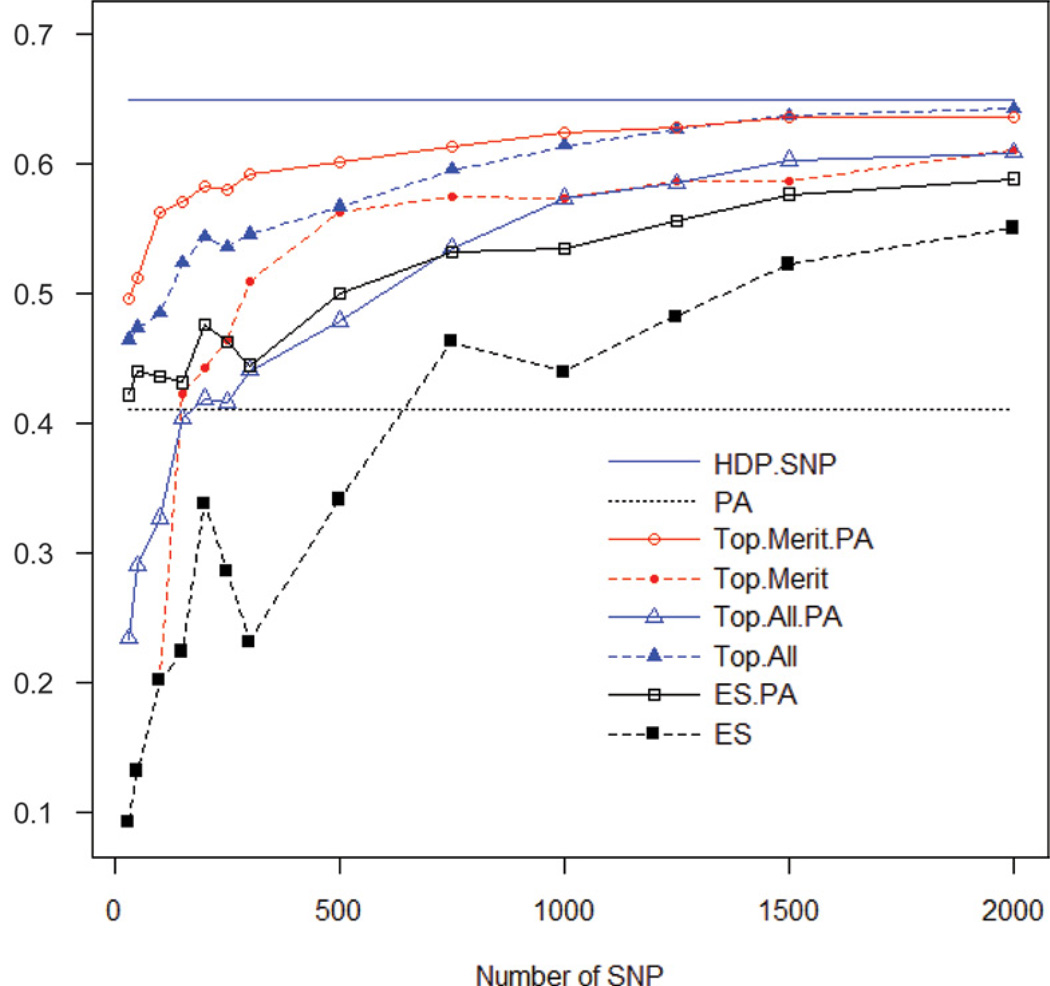
Figure 2.
Correlations between progeny-test PTA for net merit and genome-enabled predictions obtained with the high-density panel (HDP), the parent average (PA), the top SNP for HDP with (Top.Merit.PA) and without (Top.Merit) parent averages, the top SNP for 6 traits (milk, fat, protein, productive life, SCS, and daughter pregnancy rate) with (Top.All.PA) and without (Top.All) parent averages, and evenly spaced SNP with (ES.PA) and without (ES) parent averages, by set sizes of SNP. HDP.SNP (—) and PA (….) have a fixed number of SNP. Color version available in the online PDF.

