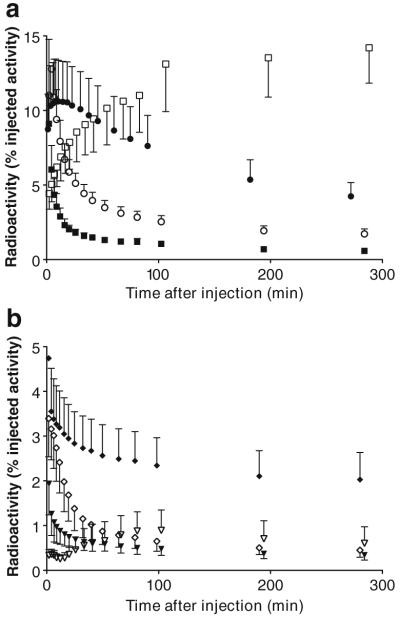
Fig. 2.
Time-activity curves for source organs with high (a) and low (b) uptake of radioactivity after injection of 18F-SP203 in seven healthy humans. Symbols represent the mean, and error bars reflect SD. a ● brain, ○ liver, ■ kidney, and □ red marrow. b ◆ lungs, ◇ heart, ▼ spleen, and ▽ gallbladder. The error bar of the peak time points for liver (12.8±3.4% injected activity at 4.3 min) and lung (4.7±1.5% injected activity at 1.8 min) are omitted because their high values would have unnecessarily extended the y-axis

