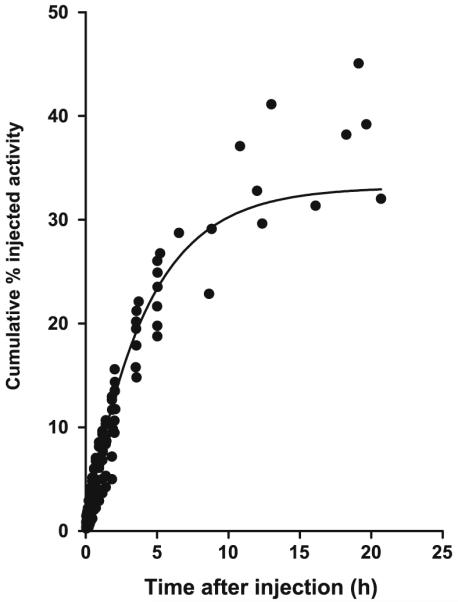
Fig. 3.

Cumulative urine activity measured from PET images and urine collection. The data were derived from all subjects and are corrected for radioactive decay. The solid line is a monoexponential curve with an asymptote of 33% and a half-life of 2.8 h. The asymptote and the biological half-life were used for the dynamic bladder model, with a voiding interval of 2.4 h, to calculate radiation dose
