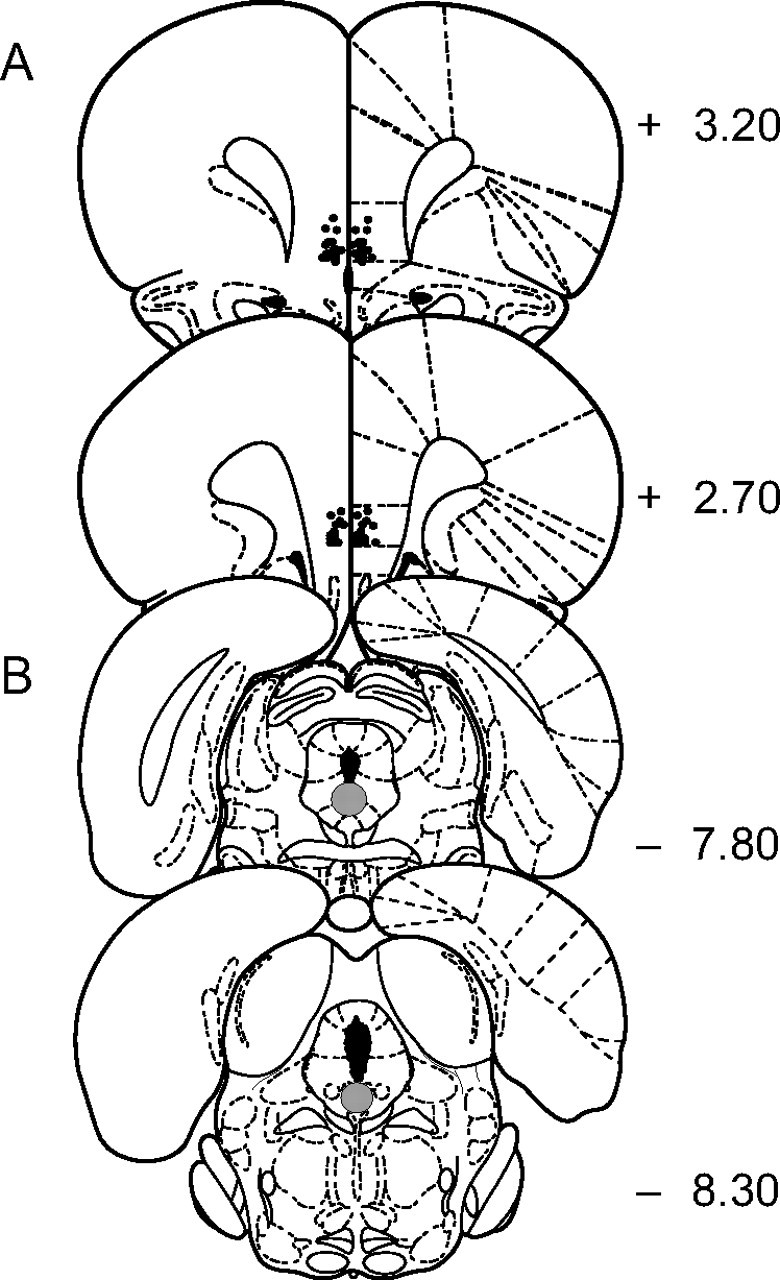
Figure 1.

A, Placements of microinjection cannulae in the mPFC. Black circles indicate the location of the cannulae tips. B, Location of single-unit extracellular recordings in the DRN. The gray-shaded areas indicate where recordings were preferentially taken. Numerals indicate distance from bregma in millimeters. Anatomical maps adopted from Paxinos and Watson (1998).
