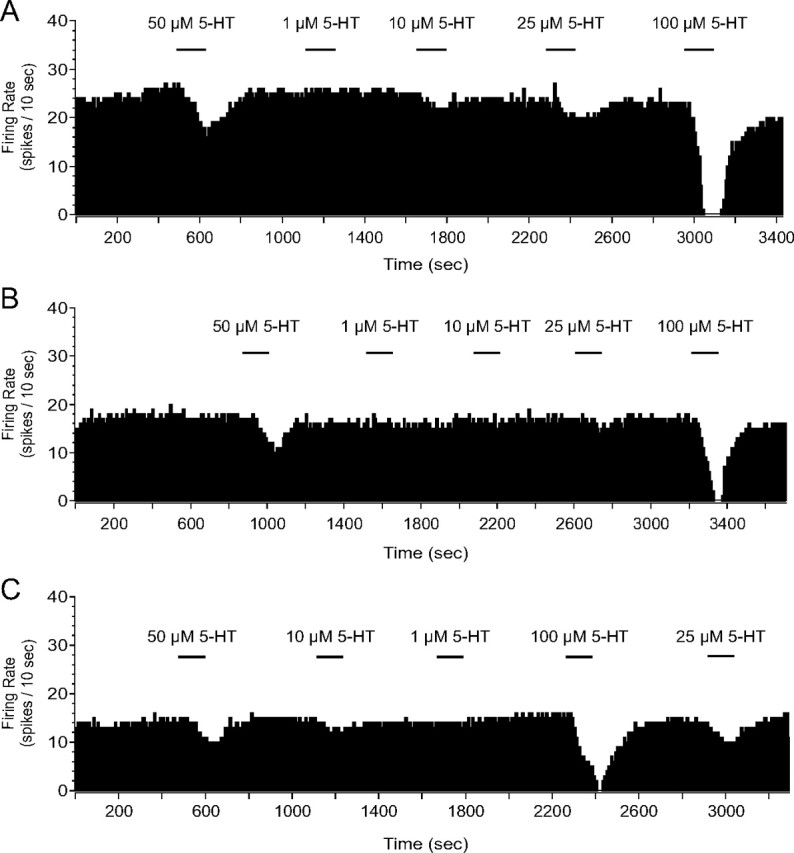
Figure 2.

Spike frequency histograms from extracellular single-unit recordings in the DRN after HC control (A), ES (B), and IS (C). Midbrain slices were taken 24 h after stress treatment, and varying doses of 5-HT were applied. Mean percentage inhibition was calculated to account for the rate at which the cell reaches maximal serotonin-mediated inhibition.
