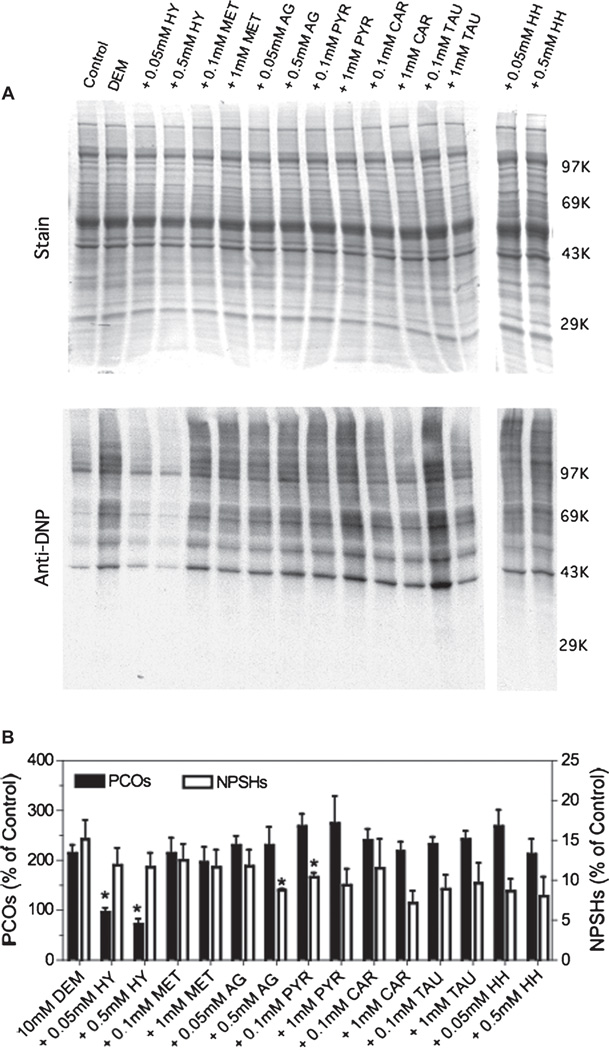
Figure 3.
Effect of carbonyl scavengers on DEM-induced protein carbonylation. Rat brain slices were incubated with 10 mM DEM in the absence or presence of two different concentrations of various carbonyl scavengers. After 2 h, slices were homogenized in PEN buffer and aliquots of the homogenate were used to determine the PCOs by western blot as described in Materials and methods. (A) Representative OxyBlot. The molecular weight markers are: phosphorylase b (97K), bovine serum albumin (69K), ovalbumin (43K) and carbonic anhydrase (29K). Other abbreviations are as in Figure 2. (B) Protein carbonylation levels obtained from western blots and NPSH levels determined spectrophotometrically with 5,5′-dithiobis(2-nitrobenzoic) acid. Values are expressed as percentage of control and represent the mean ± SEM of 3–4 experiments. Control values for carbonyls and NPSHs are 0.21 ± 0.02 nmol/mg protein and 10.8 ± 0.8 nmol/mg protein, respectively. Asterisks denote those numbers that are significantly different (p < 0.05) from DEM-treated slices.

