Figure 6.
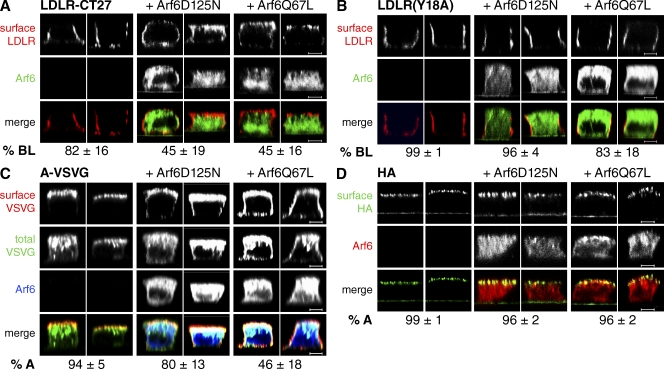
Arf6 regulates basolateral sorting of AP-1B–dependent cargos. Polarized, filter-grown MDCK cells were coinjected with plasmids encoding V5-tagged Arf6D125N or V5-tagged Arf6Q67L together with plasmids encoding LDLR-CT27 (A), LDLR(Y18A) (B), A-VSVG (C), or HA (D). (A and B) After microinjection, cells were incubated at 37°C for 1 h followed by 4 h at 20°C and 2 h at 37°C in the presence of CHX. Cells were stained for Arf6-V5 proteins and surface LDLR. For numerical data of LDLR-CT27 sorting, we analyzed 23 mock-injected cells, 24 cells coexpressing Arf6D125N, and 29 cells coexpressing Arf6Q67L from four independent experiments. P < 0.0001 for both mutant proteins in comparison to the mock control. To obtain the numerical data for LDLR(Y18A) sorting, we analyzed 29 mock-injected cells, 34 cells coexpressing Arf6D125N, and 27 cells coexpressing Arf6Q67L from at least four independent experiments. P = 0.0002 for the pair mock control versus Arf6D125N, and P < 0.0001 for the pair mock control versus Arf6Q67L. (C) Cells were incubated and stained as described for VSVG (Fig. 2). Numerical data were gathered by analyzing 26 mock-injected cells, 37 cells coexpressing Arf6D125N, and 37 cells coexpressing Arf6Q67L from three independent experiments. P < 0.0001 for both mutant proteins in comparison to the mock control. (D) To express HA after microinjection, cells were incubated for 1 h at 37°C, followed by 4 h at 20°C and 2 h at 37°C in the presence of CHX. Cells were stained for Arf6-V5 proteins and surface HA. We analyzed 28 mock-injected cells, 23 cells coexpressing Arf6D125N, and 26 cells coexpressing Arf6Q67L from four independent experiments to obtain numerical data. Note, because of the green autofluorescence of the filter supports, we quantified lateral and apical pixels for surface HA as opposed to basolateral and apical pixels, as was done in all other cases. P < 0.0001 for both mutant proteins versus mock control. (A–D) Specimens were analyzed by confocal microscopy, and representative xz sections are shown. Numerical data were obtained by determining pixel intensities of surface-stained receptors using Volocity software as described in Materials and methods. Data represent mean values, errors are SD. Bars, 5 µm.

