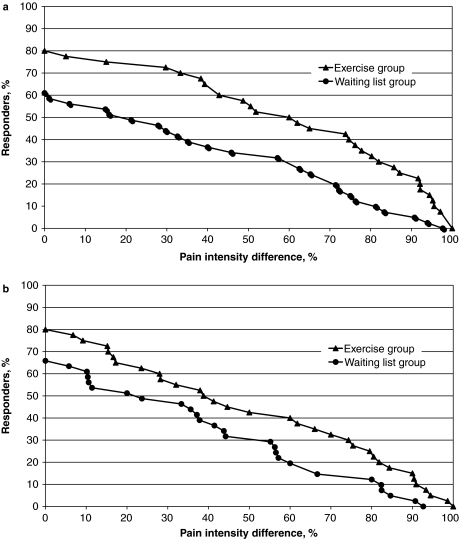
Figure 3.
Cumulative proportion of responder analysis graph showing the proportions of subjects (vertical axis) that equal or exceed a specified improvement of pain during the 3-month treatment period (horizontal axis). The exercise group had higher responder rate at all levels of change in pain score during maximum voluntary contraction (A), as well as pain score during maximum muscle elongation (B).

