Figure 2.
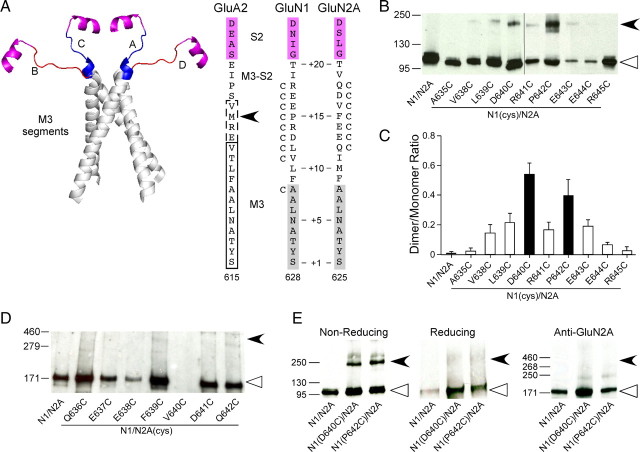
Receptors with cysteines substituted in the GluN1 but not in the GluN2A M3/M3–S2 linker yield dimers. A, Backbone structure (left) of the M3 transmembrane segment (gray)—the major pore-forming domain—and the M3/M3–S2 linkers (A/C, blue; B/D, red) that connect the M3 transmembrane segment to helix E of the LBD (magenta) (GluA2cryst, PDB accession code 3KG2). Sequence alignment (right) of residues in and around the M3/M3–S2 linker in AMPA GluA2 and NMDA GluN1 and GluN2A. Proximal S2 (helix E) is shown in magenta. For GluA2, the boxed regions indicate the α-helical extent of the A/C (dashed lines) or B/D (solid lines) conformation of M3 (Sobolevsky et al., 2009). For NMDA receptor subunits, M3, as defined by hydrophobicity (Biology Workbench), is highlighted in gray. Substitution of M629 with cysteine in GluA2 (arrowhead) yielded dimers in immunoblots (Sobolevsky et al., 2009). Positions substituted with cysteine are indicated by a “C” adjacent to the native residue. Numbering is for the mature protein (see Materials and Methods). We also used a relative numbering system, referencing the initial serine (S) in the highly conserved SYTANLAAF motif as +1 (Jones et al., 2002). B, D, Immunoblots of membrane-purified proteins isolated from Xenopus oocytes injected with wild-type or cysteine-substituted GluN1 (B) or GluN2A (D) subunits. Protein expression was assayed using antibodies against the N-terminal domain of GluN1 (B) or GluN2A (D). Open triangles and arrowheads indicate approximate location of monomer (GluN1, 114 kDa; GluN2A, 173 kDa) and dimer (GluN1, 228 kDa; GluN2A, 346 kDa) bands, respectively. The GluN2A gel was overexposed to illustrate the lack of subunit-specific dimers. Note receptors containing GluN2A(V640C) (D) showed functional currents and positive monomer signal when probed with the anti-GluN1, but we could not detect a monomer band using the anti-GluN2A antibody. C, Quantification of band intensity (see Materials and Methods) for wild-type and GluN1 cysteine-substituted mutants (n > 4 for each). Filled bars indicate values statistically different from GluN1/GluN2A (p < 0.05). E, Immunoblots of membrane-purified proteins isolated from HEK 293 cells probed for anti-GluN1 under nonreducing (left) or reducing (100 mm DTT, middle) conditions or for anti-GluN2A (right) demonstrating subunit-specific dimer formation. Open triangles and arrowheads indicate approximate location of monomer (GluN1, 114 kDa; GluN2A, 173 kDa) and dimer (GluN1, 228 kDa; GluN2A, 346 kDa) bands, respectively.

