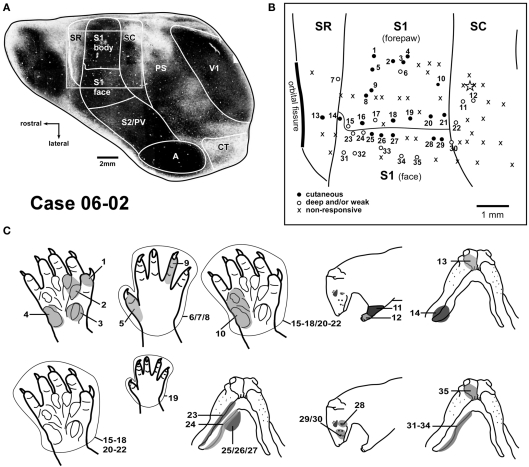
Figure 2.
Correlation between myeloarchitecture and the electrophysiological map in case 06-02. (A) Tangential section stained for myelin showing areal borders. The square frames the region represented in the upper right box (B). (B) Map of the forepaw representation and part of the face representation in areas SR, S1, and SC. Responsiveness of each site is characterized by different symbols as depicted in the inferior left corner. The star marks one tracer injection site in area SC that is further illustrated in Figure 7A. (C) Multiunit receptive fields recorded in sites depicted in (B) of this Figure are numbered accordingly in the drawings. Abbreviations: A, auditory field; CT, caudal temporal area; PS, peristriate cortex; PV, parietal ventral area; S2, secondary somatosensory area; V1, primary visual area.

