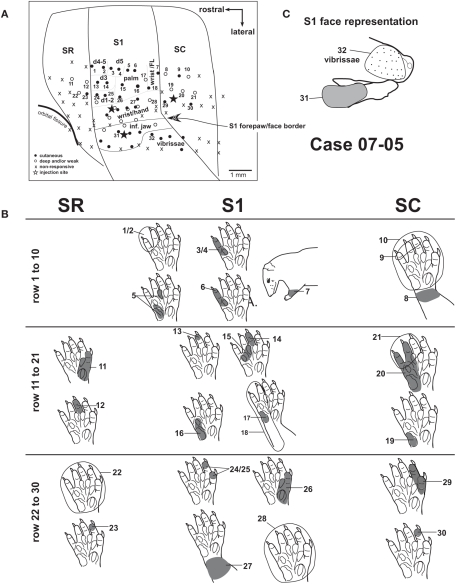
Figure 4.
Progressions of recording sites from area SR to area SC (case 07-05). (A) Electrophysiological map. Each numbered recording site has its corresponding receptive field illustrated in (B,C). Three different rows of recording sites are represented. (B) Diagram illustrating the receptive fields from the three rows of recording sites depicted in (A). Receptive fields recorded in a given cortical area are aligned in the same column of the diagram. Multiunit receptive fields in SR and SC are usually mapped with deep stimulation and tend to be larger than those in S1. (C) Receptive fields recorded at the representation of the inferior jaw and lip. The representation of vibrissae is lateral and posterior to the representation of the inferior jaw (see also Figure 3). Corticocortical connections after anatomical tracer injections in this case [black stars in (A)] are shown in Figures 6A and 8.

