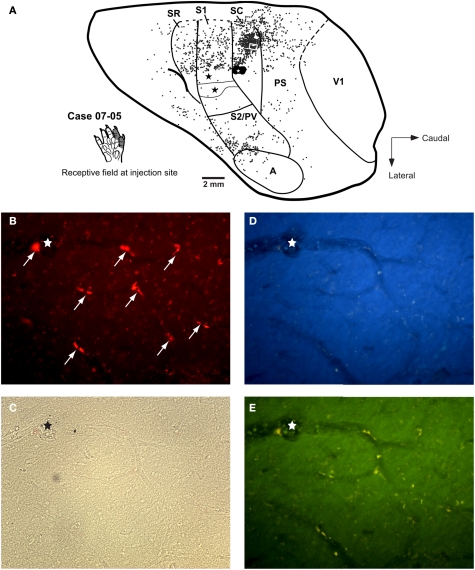
Figure 6.
Case 07-05. Corticocortical and intrinsic connections after a small FR injection in area SC. (A) Injection in the representation of digits 1–2 in area SC. Labeled cells are more numerous at the medial half of area SC as compared to the lateral half. A similar bias can be observed in area S1 (corresponding to the forepaw representation, see also Figure 4) and in area SR. Concentration of labeled cells in S2/PV probably corresponds to homotopic corticocortical connections. Additional connections originate in peristriate cortex (PS), auditory cortex (A), and “insular” cortex (i.e., the region anterior to area S2/PV). Black stars depict the center of other injection sites; one of them is illustrated in Figure 8. The white square in SC depicts the region corresponding to the photomicrographs in parts (B) to (E). (B) Representative profiles of FR-labeled (intrinsic) neurons in area SC. White arrows point to retrogradely labeled cell bodies after tracer injection in SC. (C) to (D) Photomicrographs of the same region framed in (B) obtained with brightfield microscopy (C) or using different fluorescence filters: (D) filter for UV; (E) filter for fluorescein. The region of the histological section framed in these photomicrographs did not present any DY-labeled neuron (D), see also Figure 8. Although the FR-labeled neurons (B) could also be detected as yellowish contours under the fluorescein filter (E), the specificity of this label can be confirmed by the absence of any conspicuous label under the UV-filter (D) or using the brightfield (C). The stars in (B) to (E) depict the same blood vessel for reference.

