
Fig. 8.
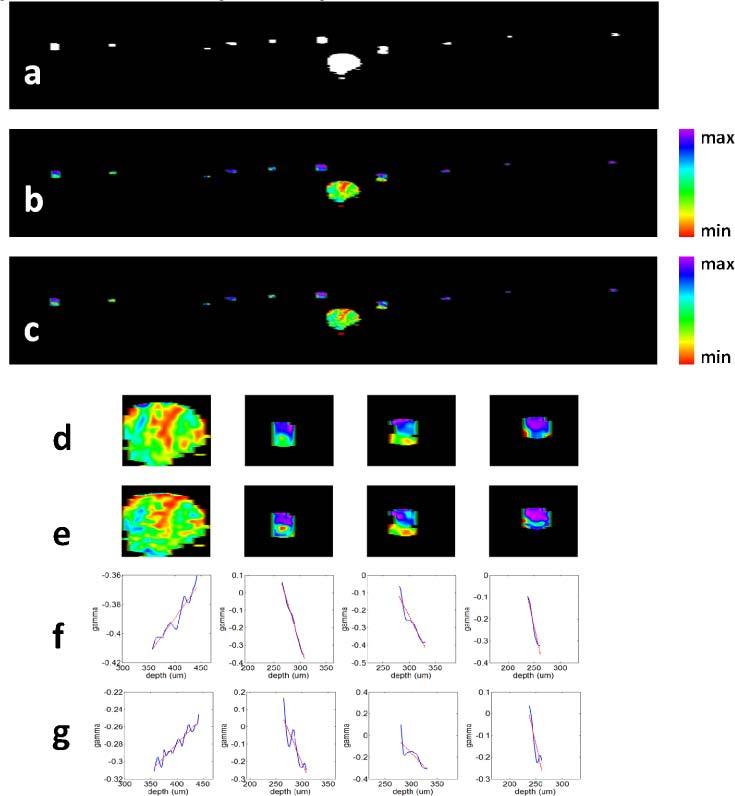
(a) Thresholded svOCT image that highlights blood vessels; (b) combined svOCT image and SOCT image obtained from STFT method; (c) combined svOCT image and SOCT image obtained from TW method; (d) the vicinities of Points 1, 2, 3 and 4 in the combined svOCT and SOCT image from STFT method; (e) the vicinities of Points 1, 2, 3 and 4 in the combined svOCT and SOCT image from TW method; (f) and (g) shows γ(z) obtained, corresponding to Point 1 to 4, from STFT method and TW method, respectively.