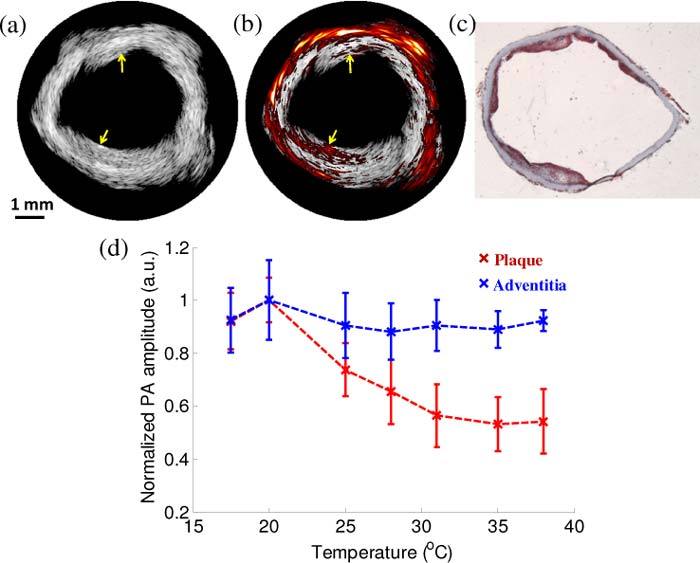
Fig. 2.

(a) IVUS and (b) combined IVUS/IVPA (1210 nm wavelength) images of the atherosclerotic vessel. The images were acquired at 25°C. Yellow arrows in these images indicate the location of atherosclerotic plaques. (c) Oil red O stain confirmed that the imaged aorta had lipid-rich plaques. The angular position of the histological slide was chosen based on the visual correlation of the shape of the vessel wall in histology and the IVUS image. (d) Comparison of the temperature dependent normalized amplitude of PA signal in plaque and the adventitia (error bars correspond to plus/minus one standard deviation).
