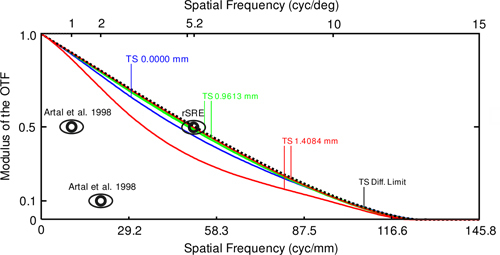
Fig. 7.

ZEMAX SC mode results, showing system (eye model and retina camera) MTF data for the imaging path at 560 nm wavelength, with spatial frequencies in object space given in cyc/mm (lower horizontal axis). The MTF diffraction limit is represented by the dotted line. Tangential (T) and sagittal (S) graphs calculated for the field points 0 mm (blue), 0.9613 mm (green), and 1.4084 mm (red), correspond to optical axes of 0°, 10°, and 15°, respectively. The spatial frequency shown on the upper horizontal axis gives MTF data in angle space in cyc/deg. Indicated (eye pictograms) are in-vivo contrast data for the rat at 1-mm pupil size (Artal et al. 1998) and schematic rat eye on-axis MTF data for the rSRE (5.2 cyc/deg at 0.5 contrast). In vivo, the contrast was 0.5 for about 1 cyc/deg and 0.1 for 2 cyc/deg, respectively.
