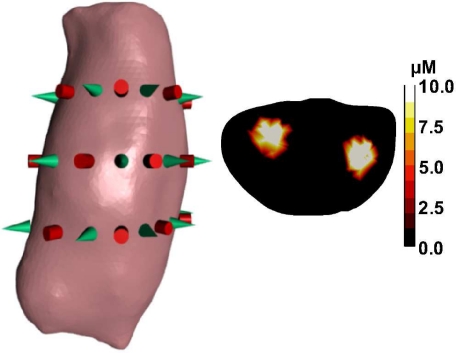
Fig. 3.
Simulation setup showing the mouse phantom, the excitation sources (cylinders) and the photon-detectors (cones). The cross-section at the height of the central optode ring shows the assumed concentration distribution which consists of two 5 mm spheres with a fluorophore concentration of 10μM.

