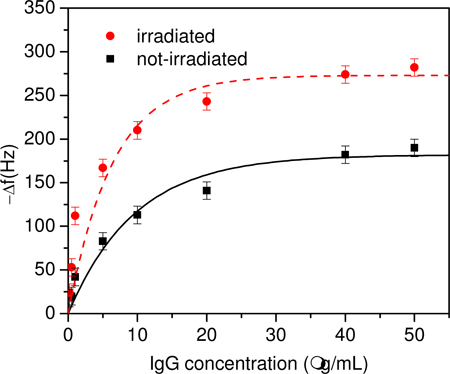
Fig. 4.

Frequency shift measured with (red circle) irradiation and without (black square) antibody UV irradiation as a function of the antigen mass concentration. The best fit obtained with Eq. (3) provides (Δf)max = 182 Hz and [M]0 = 9.6 μg/mL for the non-irradiated sample. For the irradiated sample the dashed curve is Eq. (3) with (Δf)max,IRR = 273 Hz and [M]0,IRR = 6.4 μg/mL.
