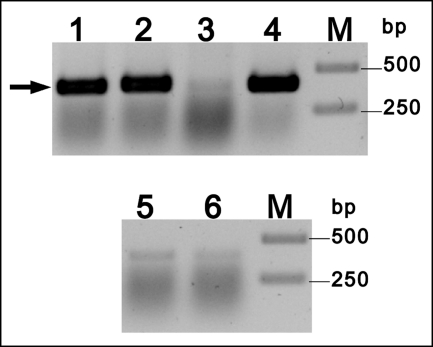
FIGURE 7.
Change in expression of the gene rosA in the time course of growth of a S. davawensis culture. The level of rosA-transcript was assessed by RT-PCR. Lane 1, the template RNA was isolated during the RoF production phase, and rosA specific primers were used. A band corresponding to a fragment of the rosA gene was detected (arrow). Lane 2, the template RNA was isolated during the RoF production phase, and gltA-specific primers were used (positive control, gltA is a constitutively expressed gene coding for citrate synthase). Lane 3, the template RNA was isolated during exponential growth phase (no RoF synthesis) and rosA-specific primers were used. Lane 4, the template RNA was isolated during exponential growth phase, and gltA-specific primer were used. Lanes 5 and 6 show the RT-PCR control reactions not containing reverse transcriptase and rosA specific primers. The template RNA was isolated during exponential growth phase and roseoflavin production phase, respectively. Lanes M, 1-kb markers.

