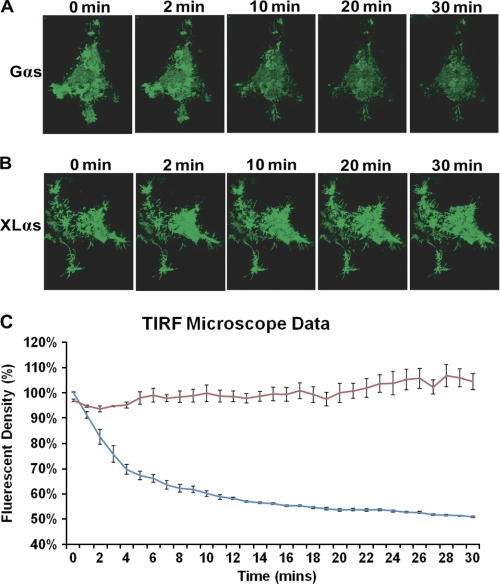
FIGURE 2.
TIRFM distinguishes the plasma membrane localizations of Gαs and XLαs upon activation of PTHR in live cells. HEK293 cells were cotransfected with cDNAs encoding either Gαs-GFP and PTHR (A) or XLαs-GFP and PTHR (B), and live imaging was performed using TIRFM. The cells were treated with 10−8 m PTH(1–34) for 30 min and monitored over time. Images show fluorescence intensity at 0, 2, 10, 20, and 30 min after ligand addition. C, intensity of GFP fluorescence was measured to study the localization of Gαs (blue) and XLαs (red) at the plasma membrane and shown as the time course. Values are normalized to fluorescence at t = 0 s, and data represent the mean ± S.D. of n = 3 experiments. The complete image sequences of the experiments shown in A and B are shown in supplemental videos 1 and 2.

