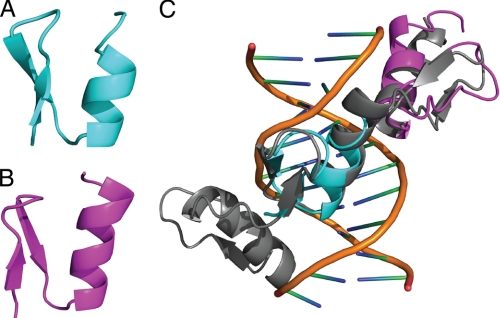
FIGURE 6.
A and B, shown are ribbon representations of the lowest energy models of finger 6 (A) and finger 7 (B) of ZNF217-F67, calculated using CS-ROSETTA, and backbone chemical shifts obtained from the analysis of triple resonance NMR data. C, shown is an overlay (backbone atoms) of F6 (cyan) and F7 (magenta) with fingers 2 and 3 from Zif268 using the structure for the latter determined in the presence of DNA (PDB 1ZAA (18)).

