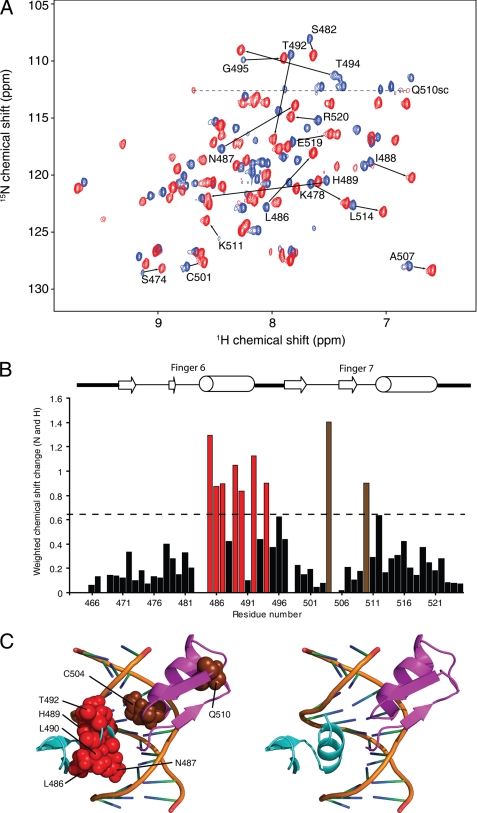
FIGURE 7.
15N HSQC titration of ZNF217-F67 with DNA. A, shown is an overlay of 15N HSQC spectra of ZNF217-F67 in the absence (blue) and presence (red) of two molar equivalents of a dsDNA oligonucleotide with the sequence 5′-CATTGCAGAATTGT-3′. Assignments are marked for selected residues that underwent substantial chemical shift changes upon the addition of DNA. B, shown are weighted average chemical shift changes for backbone nuclei of ZNF217-F67 after the addition of DNA. The dotted line indicates a change 1 S.D. greater than the mean change. Residues undergoing changes larger than 1 S.D. are shown in red (F6) or brown (F7). C, mapping of residues that underwent substantial chemical shift changes are shown. Residues from F6 and F7 are indicated in red and brown, respectively. The zinc fingers are shown in the same orientation as in Fig. 6C together with the DNA from the Zif268 structure (PDB 1ZAA).

