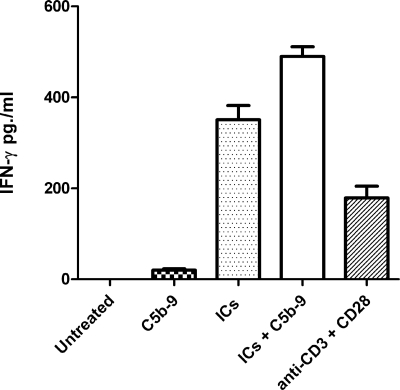
FIGURE 10.
IFN-γ production in response to nonlytic C5b-9 and SLE-ICs. Levels of IFN-γ produced by naive CD4+ T cells, untreated and treated with nonlytic C5b-9, SLE-ICs, nonlytic C5b-9 with SLE-ICs, and anti-CD3 with anti-CD28 antibodies are shown. Maximum level of IFN-γ was produced by cells treated with SLE-ICs and nonlytic C5b-9. Figure represents one of three experiments.

