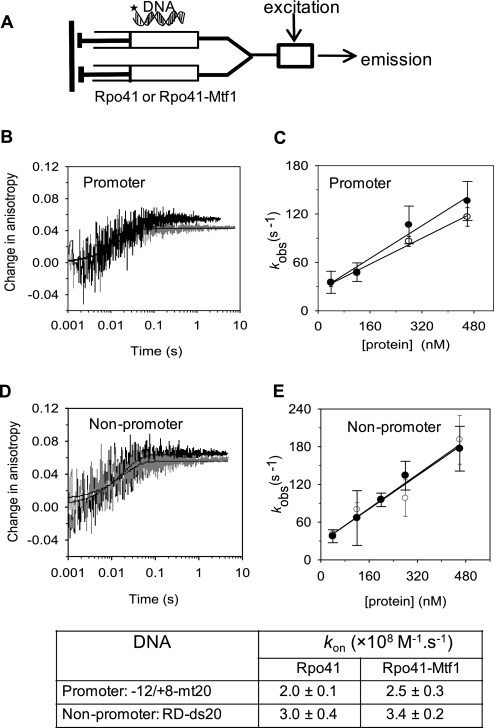
FIGURE 3.
Stopped-flow kinetics of promoter and non-promoter DNA binding. A, TMR-labeled DNA from one syringe of the stopped-flow instrument was mixed with Rpo41 or Rpo41+Mtf1 at various concentrations from second syringe. Fluorescence emission was measured in parallel and perpendicular orientation of polarizer relative to polarized excitation. B, time courses of TMR anisotropy showing the rapid increase upon mixing of 120 nm Rpo41 (black) or 1:1 mixture of Rpo41 and Mtf1 (gray) with 40 nm TMR-labeled −12/+8-mt20. Data were fit to a single exponential function to obtain the observed rate constant kobs = 46 s−1 for Rpo41 binding or 60 s−1 for Rpo41+Mtf1 binding. C, rate of binding (kobs) to −12/+8-mt20 is plotted against increasing Rpo41 (blank circle) or Rpo41-Mtf1 (filled circle). The data were fit to a linear equation to obtain the kon values listed in the table below. D, association kinetics of the TMR-labeled non-promoter DNA RD-ds20 measured similarly as in A provided kobs = 56 s−1 in the presence of Rpo41 and 57 s−1 in the presence of Rpo41 and Mtf1. E, concentration dependence of kobs against [Rpo41] (blank circle) or Rpo41-Mtf1 (filled circle) provided the kon values listed in the table below, with data uncertainties showing the range of two or more independent measurements.

