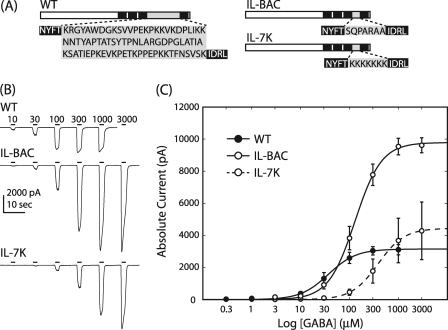
FIGURE 2.
Deletion of ILD impaired channel function. A, shown are schematics of the wild type ILD sequence and two deletion constructs. Substituted residues are highlighted in gray. B, representative whole-cell current traces for WT, IL-BAC, and IL-7K are shown. Bars indicate the duration of GABA application and are labeled with the concentration (μm). C, the Hill equation fit of peak current data show significant shifts in GABA apparent affinity and significant increases in current magnitude caused by deletion of the α1 ILD; error bars denote S.E.; n = 6.

