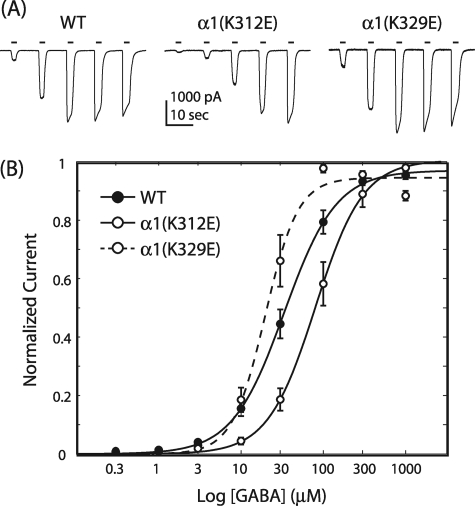
FIGURE 3.
GABA concentration-response for charge-switch mutations. A, shown are representative whole-cell current traces from WT, α1(K312E), and α1(K329E) receptor-containing cells. Bars indicate GABA application. B, the Hill equation fit of normalized peak current data shows no difference between WT and α1(K329E) but a significant increase in GABA EC50 with α1(K312E); pairwise comparison, p < 0.05; error bars denote S.E.; WT, n = 34; α1(K312E), n = 11; α1(K329E), n = 10.

