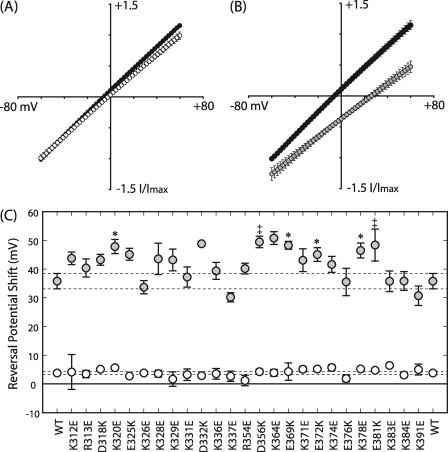
FIGURE 6.
Mutations induced a subdomain-dependent shift in anion permeability. IV relationships compare the WT response to maximally effective concentrations of GABA in normal (black) versus low sodium (white) (A) and normal (black) versus low chloride (gray) extracellular salines (B). IV data were gathered in each of the ion replacement solutions so that the relative shift in reversal potential could be determined for each patch. Each trace was normalized by its maximal response to GABA at −60 mV in the normal saline, then the up and down component of each ramp was averaged. Data points depict the mean, and error bars depict the S.E. There was no significant difference in reversal between the normal and low sodium salines; paired t test, p > 0.05. The low chloride extracellular saline caused a significant shift in reversal potential; paired t test, p < 0.05. C, relative shifts in current reversal caused by low sodium versus normal (ENS; white) and low chloride versus normal (ECS; gray) extracellular salines are shown ± S.E. Dotted lines represent the S.E. margins for WT, n = 17; mutations, n = 5; significance held at p < 0.05 for Dunnett's post hoc (‡) and Student's t test (*).

