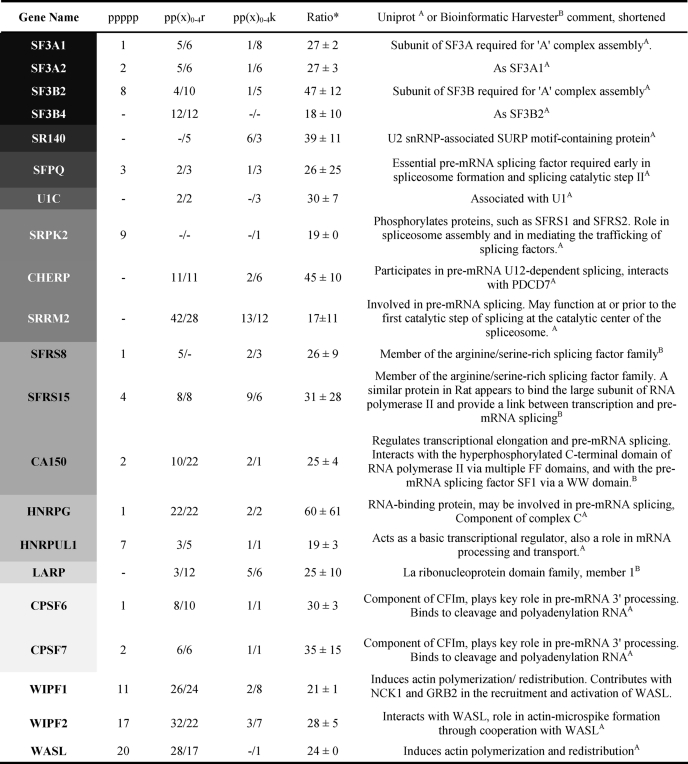
TABLE 1.
Multiple PRMs found within the 100 most highly enriched proteins
The gray intensity of the gene name column correlates with the protein complex integration/molecular function (spliceosome/splicing) and is listed top-down according to common function or localization with FBP21. Number of motifs in front of the slash represents canonically oriented motifs (N- to C-terminal), whereas those behind the slash are noncanonical (C- to N-terminal). Means of enrichment (ratio) and S.D. results are from two independent experiments, whereby in the second replicate the labeling strategy was inverted (“sample” versus “control,” see “Experimental Procedures”).

