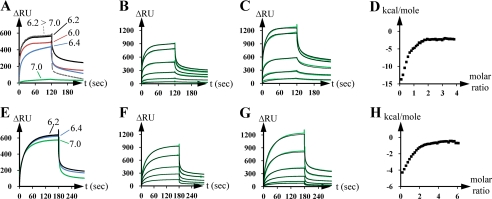
FIGURE 2.
Interaction of the OMF TolC with the MFP DevB and of the IMF DevAC with DevB in vitro. A, SPR analysis of the interaction of immobilized TolC (TolCsol_i8H in Table 2; ∼400 RU) with DevB (DevBsol; 0.8 μm) in dependence of indicated pH values. B, SPR analysis of the interaction of immobilized TolC (TolCsol_i8H; ∼440 RU) to DevB (DevBsol). DevB was injected at concentrations doubling from 0.05 μm to 1.6 μm. The green lines show the experimental data, the black lines the fit by using a two-stage/heterogeneous ligand model. C, SPR analysis of the interaction of immobilized DevB (DevBsol_c8H; ∼2400 RU) to TolC (TolCsol_iGS). TolC was injected at concentrations doubling from 0.1 to 1.6 μm. The green lines show the experimental data, and the black lines show the fit by using a two-stage/heterogeneous ligand model. D, ITC analysis of the interaction of TolC (TolCsol_iGS) to DevB (DevBsol). 10 μm TolC were titrated 40 times with 100 μm DevB at pH 6.2. The squares represent the measured and integrated energy release peaks. E, SPR analysis of the interaction of immobilized DevAC (DevAC_i8H; ∼440 RU) to DevB (DevBsol; 0.8 μm) in dependence of indicated pH values. F, SPR analysis of the interaction of immobilized DevAC (DevAC_i8H; ∼470 RU) to DevB (DevBsol). DevB was injected at concentrations doubling from 0.05 to 1.6 μm. The green lines show the experimental data, and the black lines show the fit by using a two-stage/heterogeneous ligand model. G, SPR analysis of the interaction of surface-bound DevB (DevBsol_i8H; ∼2400 RU) to DevAC (DevAC_iGS). DevAC was injected at concentrations doubling from 0.1 to 1.6 μm. The green lines show the experimental data, and the black lines show the fit by using a two-stage/heterogeneous ligand model. H, ITC analysis of the interaction of DevAC (DevAC_iGS) to DevB (DevBsol). 3 μm DevAC were titrated 40 times with 30 μm DevB at pH 6.2. The squares represent the measured and integrated energy release peaks.

