FIGURE 1.
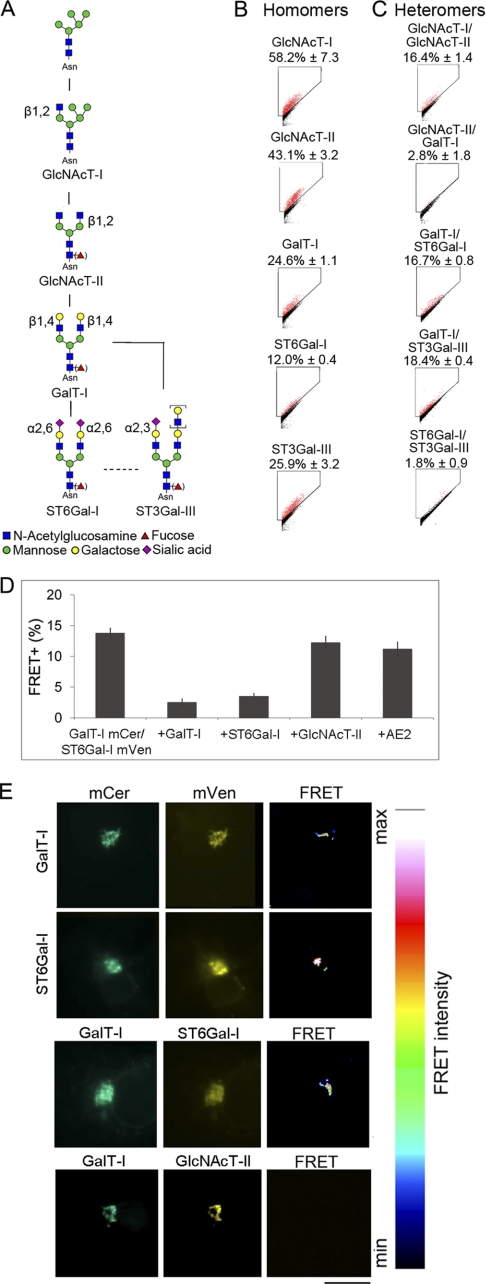
Glycosyltransferase complexes in the N-glycosylation pathway. A, schematic representation of the N-glycosylation pathway and the enzymes involved (for enzyme names, see supplemental Table S1 and the KEGG pathway database. B, homomeric interactions. C, heteromeric interactions. All values are expressed as the mean of FRET+ (± S.D.) from three independent measurements using COS7 cells. FRET gates were set to exclude FRET negative cells (black). FRET+ cells are marked as red dots. D, inhibition of FRET+ signal by competing enzyme constructs. COS7 cells were transfected using the indicated plasmid constructs and quantified by flow cytometry as described under “Experimental Procedures.” The small decrease in FRET+ cells seen with GlcNAcT-II and AE2 co-expression is likely caused by the slightly reduced protein synthesis due to co-expression of a competing or non-competing construct. E, localization of the FRET+ signal as analyzed by FRET microscopy. Briefly, COS7 cells transfected with mCer- and mVen-tagged GalT-I (first row) or ST6Gal-I (second row) were fixed and examined by fluorescence microscopy. The FRET signal was determined from the images using the built-in FRET analysis program (Youvan). Note that the FRET signal between homomeric (first and second rows) and heteromeric (third row) enzyme pairs is detected in the Golgi region only. A non-interacting enzyme pair (GalT-I/GlcNAcT-II; fourth row) does not show any FRET signal. Scale bar, 10 μm.

