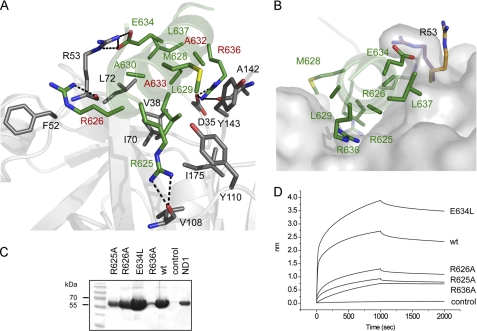
FIGURE 3.
Structural and functional studies of the p97N-gp78 peptide interaction. A, view into the binding interface. Residues involved in binding are shown in stick representation using the same color code for carbon atoms as in Fig. 2. The dashed lines indicate hydrogen bonds. B, surface representation of the binding pocket of p97N. gp78 residues involved in complex formation are shown in stick representation. The conformational change of Arg53 identified in the p97N-gp78 complex structure is indicated with carbon atoms in magenta (p97N-gp78) and orange (apo-p97N, Protein Data Bank entry 3QQ7). Shown are streptavidin pull-down assay (C) and biolayer interferometry (D) of WT p97ND1 and biotinylated gp78 peptides (WT and variants).

