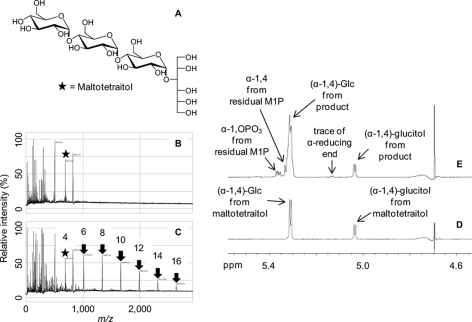
FIGURE 4.
Maltotetraitol is an acceptor for GlgE isoform I. The structure of maltotetraitol is shown in A. B shows MALDI-TOF MS of maltotetraitol where the mass of the starting material (m/z 691; [M + Na]+; highlighted with a star) is among the peaks from the matrix and other reaction mixture components. C shows the spectrum after incubation with enzyme and α-maltose 1-phosphate revealing a series of peaks (highlighted with arrows) with the successive addition of m/z 324 corresponding to maltosyl units. The DP of each peak (including the glucitol chain) is indicated. D and E respectively show 1H NMR spectra of maltotetraitol before and after incubation with enzyme and α-maltose 1-phosphate. Peak assignments are indicated.

